

See what's slowing your team down
CodePulse turns your GitHub history into root-cause insights, not just dashboards, so you see where delivery stalls and why. Set up in about five minutes at one flat price. Free to start, no credit card.
Find Your #1 BottleneckGitHub hosts code for more than 180 million developers, which makes it the default answer for collaboration, code review, and DevOps. This guide evaluates GitHub as a code-sharing and DevOps platform: what it does well, where it stops short for engineering leaders, and what to layer on top so you can actually answer the questions your board and your team keep asking.
Is GitHub a good platform for code collaboration and DevOps?
Yes. GitHub is the strongest general-purpose code collaboration and DevOps platform, with over 180 million developers, built-in pull requests, code review, branch protection, GitHub Actions CI/CD, and security scanning. It covers the core developer workflow for almost any team. Its main shortfall is engineering analytics: GitHub shows what happened, not why delivery is slow, who is overloaded, or where knowledge is concentrated. Most teams of 10+ engineers layer a GitHub-native analytics tool like CodePulse on top to close that gap, connecting in about five minutes without changing how developers work.
GitHub passed 100 million developers in 2023, two years ahead of its own target, and reached more than 180 million by the 2025 Octoverse report, adding roughly 36 million in a single year. Monthly pull request merges now average 43.2 million, up 23% year over year. When a platform reaches that scale, the question is rarely whether to use it. The question is whether GitHub alone covers what an engineering organization needs, or whether you need to add capabilities it deliberately leaves out.
"GitHub is where your code lives. It was never designed to tell you why your delivery is slow. Those are two different products, and treating one as the other is how leaders end up flying blind."
This guide evaluates GitHub as a platform: its strengths, its analytics gaps, and what to layer on top. That is a different question from how mature your delivery process is right now. If you want to score your current DevOps maturity from your own Git data, see our DevOps assessment guide instead.
What Does GitHub Do Well as a Platform?
Be specific about GitHub's strengths before evaluating its gaps. As a code collaboration and DevOps platform, GitHub covers the core developer workflow end to end.
Code Collaboration and Review
Pull requests, inline comments, suggested changes, required reviewers, and branch protection rules give teams a mature code review workflow out of the box. Protected branches can enforce passing checks, required approvals, and linear history before a merge. This is GitHub's strongest area, and it is the reason most teams standardize on it.
The review workflow also keeps absorbing what the ecosystem proves first. Copilot code review went generally available on April 4, 2025 and moved to an agentic architecture in March 2026, so GitHub now participates in reviews rather than just hosting them. Merge queue has been GA since July 2023, though it is free only for public org repos - private repos need Enterprise Cloud. And native stacked pull requests entered private preview on April 13, 2026, years after third-party tools shipped stacking - our Graphite vs GitHub comparison covers that arc.
CI/CD via GitHub Actions
GitHub Actions turns the platform into a credible DevOps engine: build, test, and deploy pipelines defined as code, triggered on push, PR, schedule, or manual dispatch. Combined with Environments, deployment protection rules, and Packages for artifacts, GitHub handles the inner DevOps loop for teams that standardize on its ecosystem.
Security and Supply Chain
Code scanning (CodeQL), secret scanning, and Dependabot give teams a baseline of supply-chain and vulnerability coverage without a separate tool. For organizations that have not yet bought a dedicated AppSec platform, this closes a real gap. CodeQL covers roughly 12 languages, and code plus secret scanning are free for public repositories. Private repos pay: since GitHub unbundled Advanced Security on April 1, 2025, scanning is two separate SKUs - Secret Protection at $19 and Code Security at $30 per active committer per month.
Planning and Documentation
Issues, Projects (boards and tables), Discussions, Wikis, and the new Copilot assistance for org-wide search round out the platform. GitHub Projects offers basic burndown and velocity charts for issue boards, which is closer to lightweight project tracking than engineering analytics, but it covers planning for teams that do not run a separate Jira or Linear.
| Capability | GitHub Native Coverage | Verdict |
|---|---|---|
| Source control + branching | Git hosting, protected branches, rulesets | Excellent |
| Code review | PRs, required reviewers, suggested changes | Excellent |
| CI/CD | GitHub Actions, Environments, Packages | Strong |
| Security scanning | CodeQL, secret scanning, Dependabot | Good baseline |
| Planning | Issues, Projects, Discussions | Lightweight |
| Engineering analytics | Contributors graph, Pulse, Traffic | Surface-level only |
For a deeper look at the raw signals GitHub exposes, see our GitHub metrics guide and the GitHub repository metrics guide.
Where Does GitHub Fall Short for Engineering Leaders?
GitHub's three analytics surfaces (the Contributors graph, Pulse, and Traffic) plus Copilot usage metrics are built for repository maintainers, not engineering leaders. They tell you what happened, not why, where the risk is, or whether you are improving. Here are the gaps that cost teams the most.
No Cycle Time Decomposition
GitHub shows that a PR merged. It does not show that the PR sat three days waiting for review, was reviewed in 20 minutes, then sat two more days waiting for merge. LinearB's study of nearly 3,000 teams found the average cycle time is about seven days, with the PR sitting in review for four of those seven days. Without the phase breakdown, you cannot find the bottleneck.
No Review Load Visibility
GitHub does not surface which reviewers are overloaded. When one senior engineer quietly handles 40% of all reviews, that is invisible in GitHub but a clear single point of failure and burnout risk. Reviewer concentration is one of the most common causes of slow delivery, and it is entirely hidden in native tooling.
No DORA Metrics
GitHub does not natively report deployment frequency, lead time for changes, change failure rate, or mean time to recovery. The 2024 DORA report found elite teams deploy 182x more frequently and have 127x faster lead times than low performers. GitHub cannot tell you which cluster you are in, let alone trend it over time.
No Knowledge Silo Detection
If one engineer is the sole contributor to a critical service, that is a bus factor of one. The Contributors graph shows commit counts but never flags concentration risk at the file or directory level.
No Cross-Repository Rollups or Alerting
GitHub Insights is per-repository. A team working across 15 repos gets 15 separate dashboards with no aggregation. Pulse is a single-period snapshot with no trend comparison and no way to set an alert like “notify me if any PR sits in review more than 48 hours.”
"The Contributors graph is a commit counter with a date axis. Calling it engineering analytics is like calling an odometer a fleet management system."
🔥 Our Take
GitHub will never build deep engineering analytics, and that is the right call for them. Their business is hosting code and selling Copilot seats, not telling VPs why their cycle time doubled.
Stop evaluating GitHub on a dimension it was never built for. Evaluate it as the best code collaboration and DevOps platform available, which it is, and then decide what analytics layer to put on top. The mistake is not choosing GitHub. The mistake is assuming the Contributors graph answers questions it was never designed to touch.
What Does GitHub Cost Beyond Seats?
The published seat prices are the easy part: Free (unlimited public repos, 2,000 Actions minutes a month), Team at $4/user/month, and Enterprise Cloud at $21/user/month with 50,000 Actions minutes, per github.com/pricing. An honest evaluation models the four add-ons that arrive after the seats:
- Security scanning (private repos). Secret Protection $19 + Code Security $30 per active committer per month since the April 2025 unbundling. A 100-committer org enabling both pays roughly $58,800 a year on top of seats - for comparison, Azure DevOps bundles its equivalent at $49/active committer/month.
- Actions overages. $0.008/minute on Linux runners beyond your plan allowance. Busy monorepos with matrix builds burn allowances quickly.
- Copilot. Copilot moved to usage-based billing via GitHub AI Credits on June 1, 2026. Agentic workflows consume credits, so the AI line item is now variable rather than a flat per-seat fee - budget from measured usage, not list price.
- Analytics. GitHub ships none beyond activity graphs, so delivery measurement is a third-party line item whichever vendor you pick.
"The seat price is the floor, not the bill. For a private-repo organization, security alone can cost more per committer than the Enterprise seat it sits on."
How Do You Evaluate GitHub Against Your Needs?
Use a capability checklist instead of a vibe check. Score GitHub against the four questions engineering leaders actually have to answer, and the gaps become obvious.
| Question You Need to Answer | GitHub Native | Needs Analytics Layer |
|---|---|---|
| Can my team collaborate on code safely? | Yes (PRs, branch protection) | No |
| Can I ship via automated pipelines? | Yes (GitHub Actions) | No |
| Why is delivery slower this quarter? | No | Yes (cycle time decomposition) |
| Who is the review bottleneck? | No | Yes (review network) |
| What is our bus factor on payments? | No | Yes (file hotspots) |
| Are we DORA elite, high, or medium? | No | Yes (DORA dashboard) |
| Can I hand the board a health grade? | No | Yes (executive summary) |
If every question that matters to you sits in the top two rows, GitHub alone is enough. The moment a question lands in the bottom five rows, you are evaluating an analytics layer, not a replacement for GitHub. Teams weighing GitHub against another platform entirely should read our Azure DevOps vs GitHub guide for a platform-level comparison.
When GitHub Alone Is Genuinely Enough
- Solo or 2-3 person teams: You can see everything in your PR list without formal analytics.
- Open-source maintainers: Traffic and contributor graphs cover community engagement tracking.
- No reporting requirements: If nobody asks you for delivery metrics, a separate tool is overhead.
- Pure Copilot ROI tracking: GitHub's built-in Copilot metrics cover AI adoption rates on their own.
What Should You Layer on Top of GitHub?
The answer is not to replace GitHub. It is to add an analytics layer that reads GitHub data and decomposes it into the signals leaders need. A GitHub-native analytics tool reaches deeper than the broad multi-tool platforms because it does not have to normalize across GitLab, Bitbucket, and Jira. CodePulse takes this approach: connect the GitHub App, select repositories, and see real metrics in about five minutes.
Cycle Time Decomposition
CodePulse breaks cycle time into four phases (coding, waiting for review, in review, merge) and refreshes every 15 minutes. LinearB's benchmark of nearly 2,000 teams found that teams needing improvement take over 19 hours just to start a review, so the waiting-for-review phase is usually where the time hides. The dashboard shows that breakdown updating throughout the day, not once at midnight.
Review Network Visualization
The review network maps who reviews whose code. When one engineer is carrying 40% of all reviews, CodePulse shows it as a graph instead of leaving you to guess in standup.
File Hotspots and Knowledge Silos
File hotspots identify modules with high churn and single-author dependencies. A critical file that only one person understands is a business risk GitHub's contributor graph cannot flag.
📊 How to See This in CodePulse
After connecting your GitHub org (5-minute setup, no GitHub configuration changes), navigate to:
- Dashboard for the 4-phase cycle time breakdown across all repos
- Review Network to spot reviewer overload instantly
- File Hotspots for bus factor and knowledge silo detection
- Executive Summary for a board-ready health grade you can export
- Alert Rules to get notified when PRs breach your review SLA
How Does an Analytics Layer Connect to GitHub?
The migration path is additive. You change nothing about how developers work; you add a read-only analytics view on top.
Step 1: Install the GitHub App → grant read access to selected repos
Step 2: CodePulse syncs up to 6 months of PR, review, and commit history
Step 3: Review the cycle time dashboard → find your biggest bottleneck
Step 4: Set alert rules → catch stuck PRs before they age
Step 5: Share the executive summary → give leadership real delivery data

Time investment: ~5 minutes setup, then ~10 min/week reviewing dashboards
No GitHub configuration changes. No workflow disruption for developers.
Because CodePulse is GitHub-native, it goes deeper on PR, review, and file-level data than broad platforms that have to support every source control system. The trade-off is scope: CodePulse is GitHub-only and does not cover Bitbucket. For a side-by-side of the native signals against a full analytics layer, see our CodePulse vs GitHub Insights comparison.
"The right question is not GitHub or something else. It is GitHub for the workflow, plus a thin analytics layer for the answers GitHub was never built to give."
If you want to see what the analytics layer looks like on your own repositories, start a free trial. You will see real data from your GitHub org in about five minutes, with no sales call and no changes to your existing setup.
What Are GitHub's Strengths and Weaknesses as a Development Platform?
Weighing GitHub as a development platform comes down to a straightforward trade: it is the most ubiquitous place to host and review code, but its own analytics stay shallow by design. The benefits are real and well documented. GitHub's Actions documentation describes hosted Linux, Windows, and macOS runners plus a marketplace of reusable actions, which is why so many teams standardize their CI/CD there once they are already hosting code on GitHub. Pull requests, required reviewers, and branch protection rules give teams a review workflow they do not have to build themselves, and the sheer size of the ecosystem means new hires already know the interface.
The drawbacks sit almost entirely in reporting. GitHub's own repository graphs documentation confirms that contributor, commit, and code frequency insights only work for repositories under 10,000 commits, and every graph is scoped to a single repository with no built-in way to roll data up across a team or org. There is no cycle time phase breakdown, no reviewer load balancing, and no trend comparison beyond the current period snapshot. Teams that need that layer typically add it rather than replace GitHub; see our CodePulse vs GitHub Insights comparison for where that line sits.
| Benefits | Drawbacks |
|---|---|
| 180M+ developer ecosystem, near-universal familiarity | No cycle time phase breakdown (coding, waiting, review, merge) |
| Mature PR review workflow with branch protection rules | No cross-repository or cross-team rollups |
| GitHub Actions covers CI/CD without a separate tool | Commit/contributor graphs cap out at 10,000 commits per repo |
| Built-in security scanning (CodeQL, Dependabot) | No DORA metrics or historical trend comparison |
| Issues and Projects cover lightweight planning | No reviewer load balancing or knowledge silo detection |
None of this makes GitHub a bad choice. It means GitHub is a strong SDLC platform paired with a reporting layer built for repository maintainers, not engineering leaders. If those reporting gaps are what brought you here, that is exactly the ground our CodePulse vs GitHub Insights guide covers in more depth.
Frequently Asked Questions
Frequently Asked Questions
Yes. GitHub is the strongest general-purpose code collaboration platform available, with over 180 million developers and built-in pull requests, code review, branch protection, and CI/CD via GitHub Actions. It covers the core code-sharing and review workflow for almost any team. Where it falls short is engineering analytics: GitHub shows what happened (commits, merged PRs) but not why delivery is slow, who is overloaded with reviews, or where knowledge is concentrated. Most teams layer a GitHub-native analytics tool on top to close that gap.
Related Guides
- CodePulse vs GitHub Insights – Where GitHub's built-in analytics stop and a dedicated layer starts
- GitHub Metrics Guide – The signals you can and cannot pull from GitHub natively
- GitHub Repository Metrics Guide – Per-repo metrics and how to roll them up across an org
- Azure DevOps vs GitHub – A platform-level comparison for teams weighing both
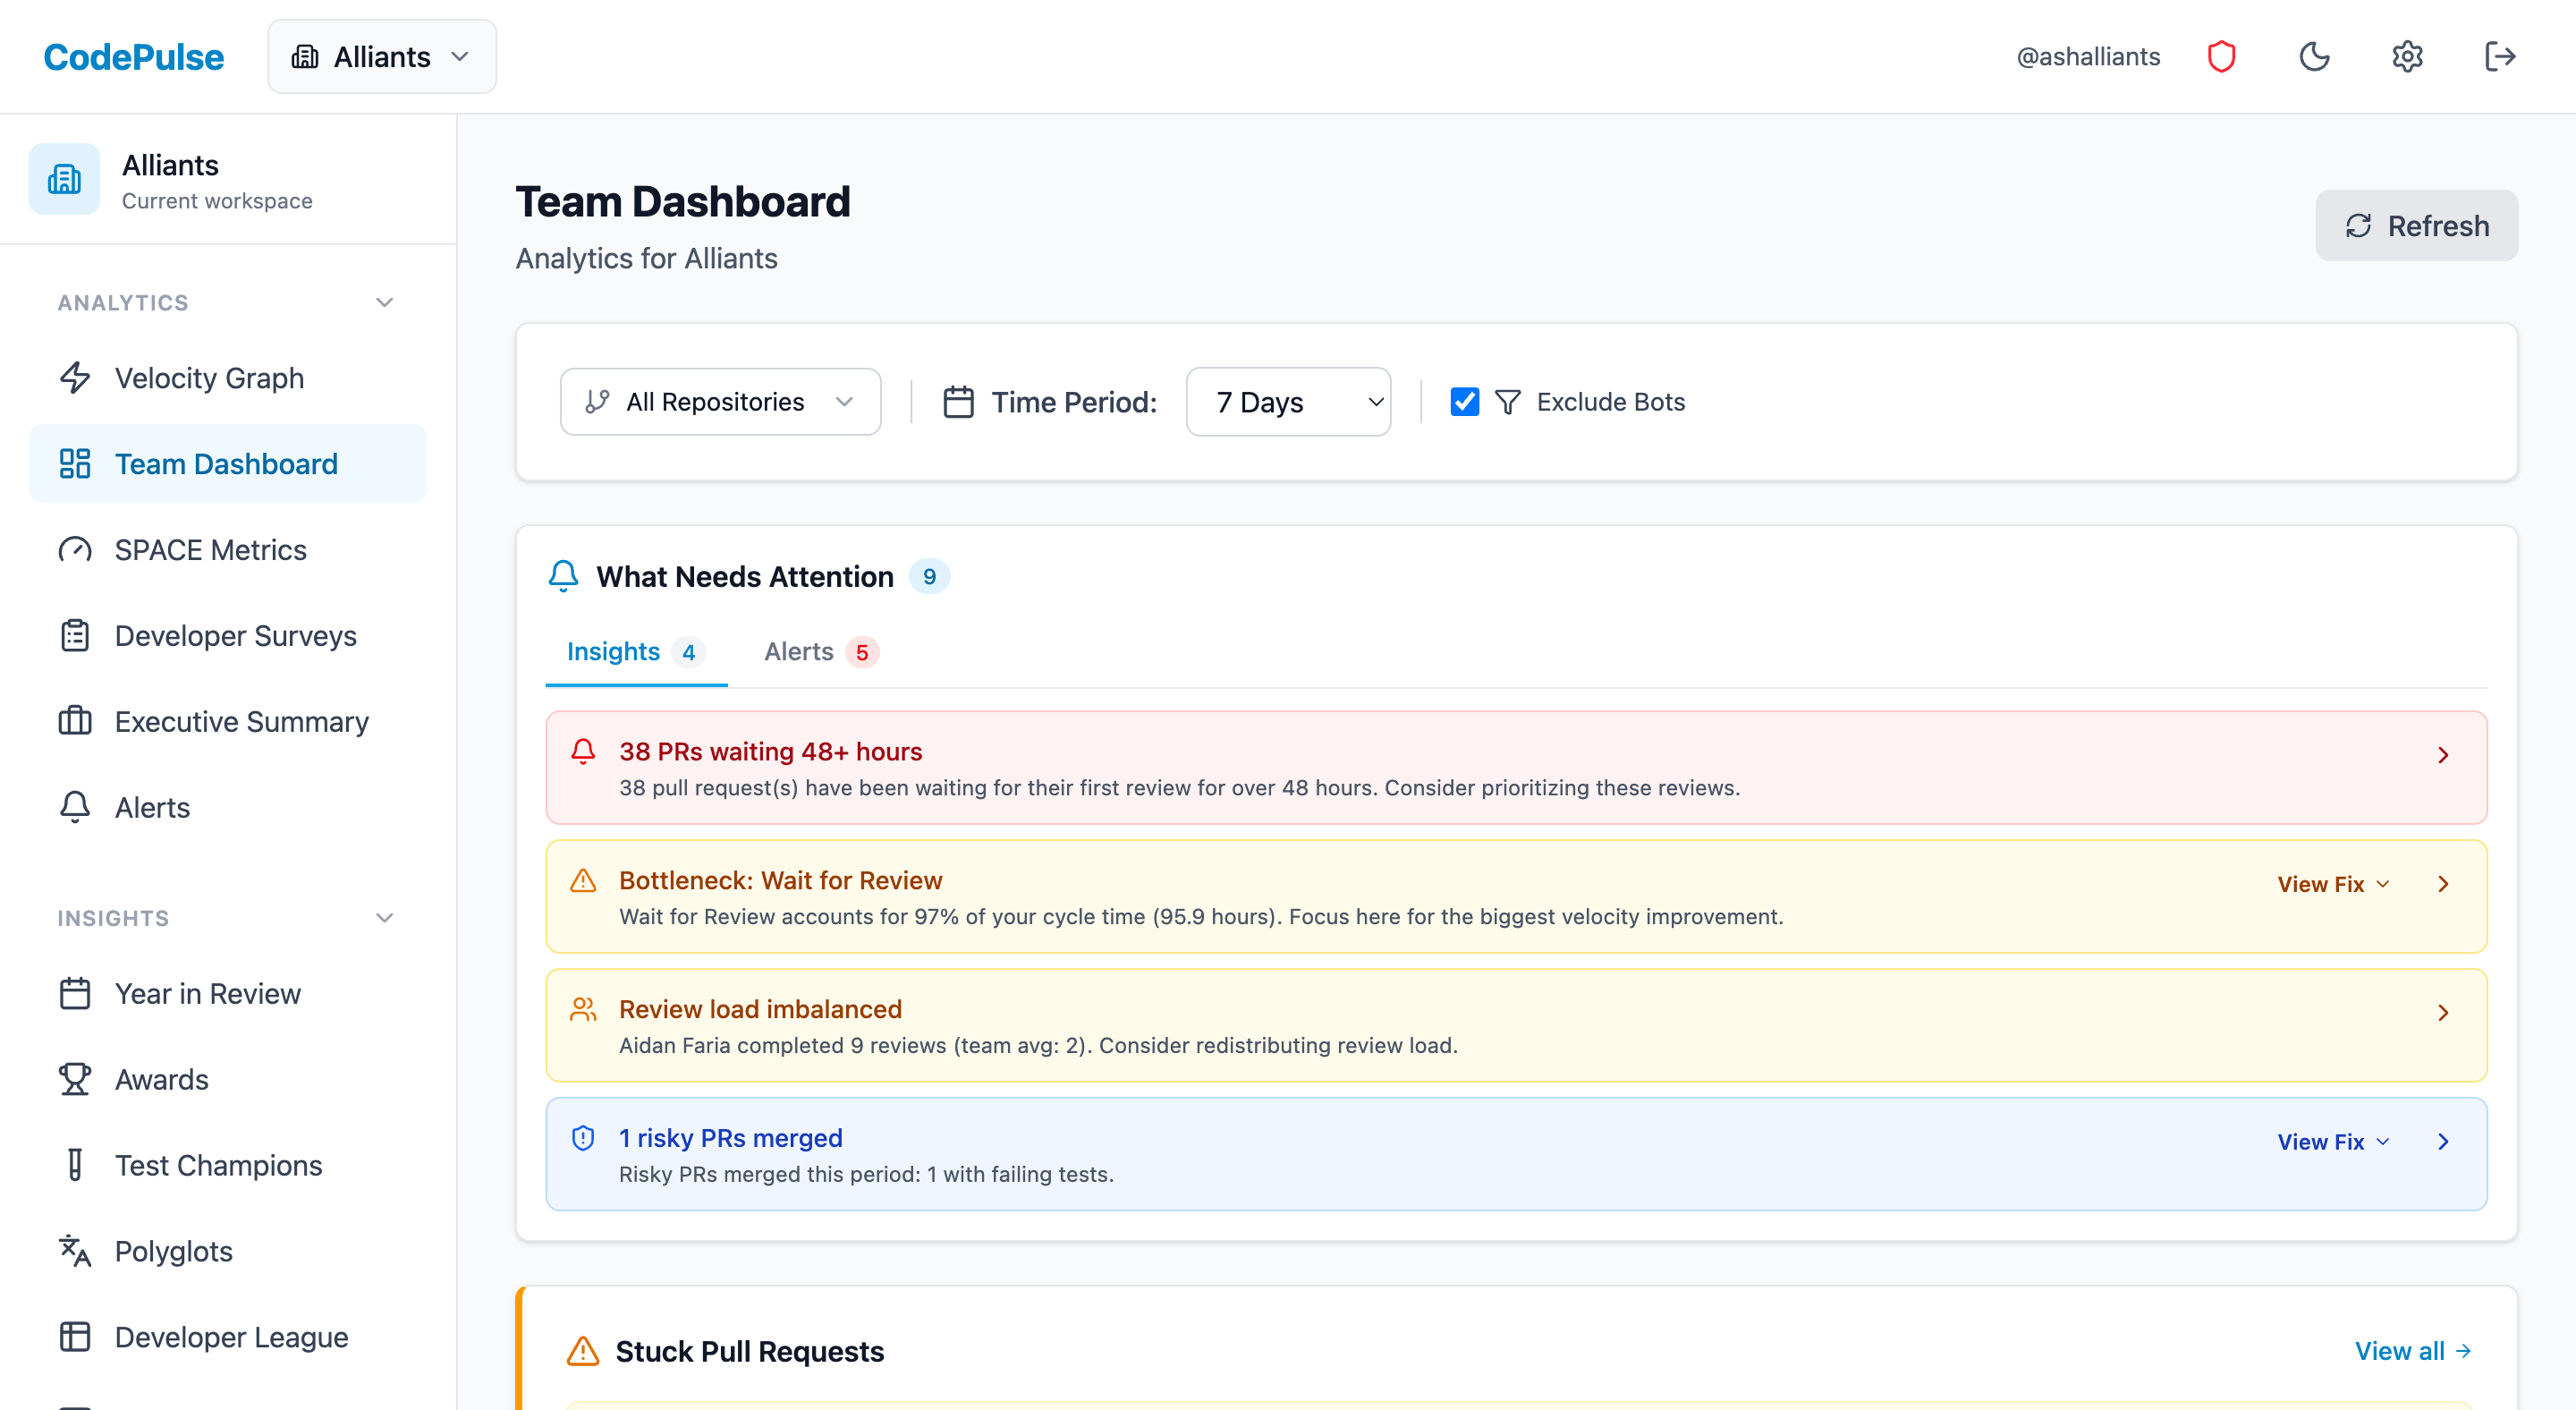
Your whole engineering org's health, in one dashboard
Connect GitHub and get root-cause metrics and a board-ready summary in about five minutes. One flat price, no per-seat math.
Free tier available. No credit card required.
See These Features in Action
Break down cycle time into coding, waiting, review, and merge phases.
Board-ready engineering performance in a single page.
Related Guides
CodePulse vs GitHub Insights: When Free Isn't Enough
GitHub's built-in Insights are free but surface-level. This guide compares GitHub Insights against CodePulse for cycle time, review networks, DORA metrics, and alerting.
GitHub Metrics: What to Track and What to Ignore
GitHub is a goldmine of engineering data. This guide shows which GitHub metrics actually matter (PR cycle time, review load, knowledge distribution), how to build a useful dashboard, and which vanity metrics to avoid.
Azure DevOps vs GitHub: 2026 Comparison (Both Tested)
Azure DevOps vs GitHub compared: pricing, CI/CD, AI features, project management, analytics, and migration paths. Side-by-side guide for engineering leaders choosing between Microsoft platforms.
GitHub Is Hiding Your Repo's Real Health Score
Learn which repository-level metrics matter for engineering managers and staff engineers, how to track them across multiple repos, and when to intervene based on health signals.